The Door We Stopped Opening
Americans spend more time at home. What does that explain about friendship, dating, and the feeling that life has become smaller?
Imagine two perfectly reasonable Friday evenings.
On the first, you collect dinner, pass a neighbor, and stop to talk. The conversation is unremarkable until the neighbor mentions that someone you both know is nearby. A five-minute errand becomes an hour you could not have planned.
On the second, dinner arrives at your door. You eat something good, watch something good, and get to bed at a sensible time. Nobody has made a bad decision. Yet the evening has fewer openings through which another person might enter it.
These are imagined scenes, not a report about a particular neighborhood. They describe the puzzle behind Cole Jaczko’s post: could rising time at home explain the apparent fading of friendship, excitement, spontaneity, and dating?
The post pairs that question with a striking chart. It is tempting to see the bars as a diagnosis: we closed our doors, and life contracted.
The evidence supports part of that intuition. It does not support the whole diagnosis. Americans have spent more time at home, and a newer study documents less time physically alongside friends. But a location is not an emotion, and two trends moving together do not tell us which caused which.
The useful question is more specific: when ordinary life no longer brings us into contact, how do we make room for contact to happen?

First, read the date on the chart
The image in the post ends in 2022. It is not a measurement of September 2026.
Its credited researcher, Princeton sociologist Patrick Sharkey, published Homebound in 2024. Using the American Time Use Survey, he estimated that Americans aged 15 and older spent 99 more minutes per day at home in 2022 than in 2003, after accounting for demographic and economic characteristics. By 2019, the increase already exceeded half an hour; the pandemic then produced a sharp jump. Paper, Figure 1 and discussion
There is a small but revealing detail in the measurement. “Home” includes the respondent’s yard. Because the survey does not record sleeping locations, the main estimate assumes sleep happens at home. The upward trend also appears when sleep is excluded. This is a measure of daily location, not simply hours sitting indoors.
The survey collects a day’s diary from different respondents over time. It does not follow the same people for nineteen years. Nor does the 99-minute difference tell us which activities every individual gave up. Methods, PDF pages 6–8
That last point matters. A national average can describe a substantial shift while concealing very different lives: someone working from a spare room, someone caring for a parent, someone enjoying retirement, someone unable to leave.
Home, alone, and lonely are different questions
Consider a kitchen full of friends. Then consider a crowded train on which nobody would notice if you disappeared at the next stop.
The first person is home. The second person is out. The addresses tell us little about belonging.
| Question | What it tells us | What it cannot settle |
|---|---|---|
| Where are you? | Home, workplace, park, somewhere else | Whether the experience feels connected |
| Who is physically there? | Alone, with friends, with family | Whether distant contact matters to you |
| Do you feel connected enough? | Your experience of belonging | Your location or head count |
The CDC distinguishes social isolation, a lack of relationships, contact, or support, from loneliness, the felt gap between the connection someone has and wants. One can occur without the other. CDC definitions
A quiet reader may be content. A person at a party may feel profoundly disconnected. A video call may matter a great deal even though the other person is not in the room. Any argument that treats all three columns as interchangeable will overstate what a time-use chart can prove.
The newer evidence: Friday has changed
There is evidence closer to the friendship question. In August 2026, sociologist Neal Caren published an analysis of 243,095 adults aged 18 and older, using time diaries through 2024. It compares the share of time spent physically with friends across the week. Socius paper
Friday’s evening peak fell from about 9% in 2003–2005 to 7% in 2017–2019 and 4% in 2022–2024. These are peaks in the hourly pattern, not the percentage of people who have friends or an average for the entire evening.
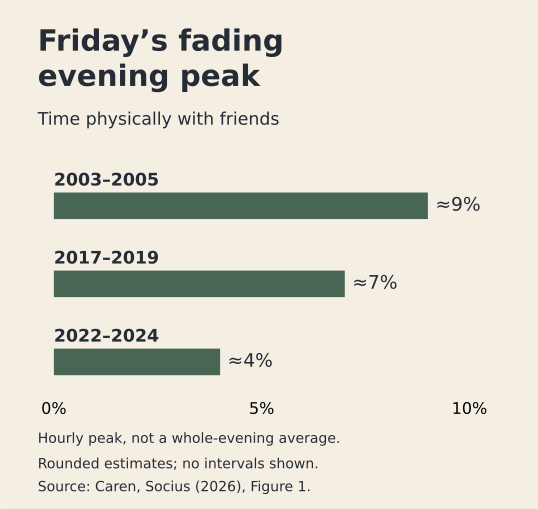
The study excludes calls, group chats, and other distant contact from this measure. It cannot establish that staying home caused the decline. And because it uses the same underlying survey as Sharkey, it is a different analysis, not an independent second data collection.
Still, the distinction between a publication date and a data date gives us a better answer than recycling an old image as breaking news. The newer paper extends the friendship evidence to 2024. It does not make the original home chart current.
What could disappear between the errands?
Return to the two imagined Fridays. The second evening removed a little inconvenience. It also removed a possible encounter. Nothing guarantees that the encounter would have been pleasant, let alone important. But it was an opportunity that the delivery could not provide in the same way.
Here is the proposed mechanism, rather than a result established by the chart:
flowchart TD
  accTitle: One possible pathway from changed routines to fewer encounters
  accDescr: A hypothesis: replacing an outing with a home activity can remove a shared setting, reducing an opportunity for an unplanned conversation and a later invitation. None of these outcomes is inevitable.
  A["AN OUTING IS REPLACED<br/>An activity moves home"] --> B["ONE LESS SHARED SETTING<br/>Fewer people cross your path"]
  B --> C["ONE LESS POSSIBILITY<br/>A conversation or invitation"]
  class C anchor;
A possible pathway, not a measured causal chain. An invitation at home or contact online can create other opportunities.
Spontaneity sounds like the opposite of routine. In the imagined neighborhood, it depends on routine: taking the same route, recognizing the same person, having somewhere to linger. An unscheduled conversation needs people to coincide somewhere first.
That suggests a way to interpret the feeling that life has become smaller. Perhaps some people have not lost their appetite for friendship. Perhaps their days offer fewer occasions on which that appetite can meet another person’s availability.
The time-use studies cannot tell us how much of the national change this mechanism explains. They also cannot assign the change to a single technology. Ordering dinner, calling an old friend, watching a film, and arranging a neighborhood gathering can all involve the same phone. The device alone does not tell us what happened to the relationship.
The arrows can run the other way
Suppose a friend moves away. You may stay home more because there is one fewer person to visit. In that case, shrinking social contact helped change the location of your evening.
Or imagine that the last bus leaves before a gathering ends. Both the missed gathering and the evening at home might result from the transport problem. Counting more home time would detect the consequence without identifying the obstacle.
flowchart TD
  accTitle: Three explanations the home chart cannot separate
  accDescr: More time at home could reduce encounters; fewer available companions could increase time at home; or an obstacle such as inaccessible transport could contribute to both. These are alternative hypotheses.
  A["POSSIBILITY 1<br/>More home time<br/>reduces encounters"]
  B["POSSIBILITY 2<br/>Fewer available companions<br/>increase home time"]
  C["POSSIBILITY 3<br/>A shared obstacle<br/>changes both"]
  A ~~~ B
  B ~~~ C
  class C anchor;
Three possibilities compatible with an association. A rising bar cannot choose among them.
The barriers deserve more than a footnote. The CDC identifies limited transport, disability, and unequal access to community resources among relevant risks for disconnection. Safe parks, libraries, and places to gather affect the opportunities people have. Community conditions
Telling someone to be more spontaneous does not make a staircase accessible or create childcare. A useful response has to ask what would make an invitation possible for the person receiving it.
Home has benefits the argument must keep
There is a straightforward objection to making home the villain: sometimes being there improves life.
A randomized trial at Trip.com assigned 1,612 graduate employees to either five office days or a hybrid schedule with two home days. Over six months, the hybrid group had higher job satisfaction and a lower quit rate: 4.8% versus 7.2%. The 2024 Nature paper found no damage to measured performance. Bloom, Han, and Liang
That trial concerns one company’s employees and a particular hybrid arrangement. It does not test loneliness, friendship, or fully remote work. It does show why “more home time means a worse life” is too crude a rule.
An avoided commute could leave room for a friend. It could leave room for sleep. It could disappear into another obligation. The important question is what the flexibility makes possible, not whether a day’s map contains the correct number of miles.
This also keeps the argument consistent with a simple value: rest does not need to earn its place. An evening alone is not a failed networking event. We can defend the freedom to stay in while noticing when people lack the relationships they want.
Dating needs its own evidence
The original post includes dating in its list of losses. It deserves separate treatment because a changing route to a relationship is different from a declining chance of finding one.
Michael Rosenfeld, Reuben Thomas, and Sonia Hausen analyzed a nationally representative 2017 survey. Among U.S. heterosexual couples, meeting online had overtaken meeting through friends around 2013. Their 2019 paper documents a change in how couples met. It does not establish that staying home caused today’s dating frustrations. Author manuscript of the PNAS paper
A friend’s introduction and an online introduction offer different experiences. One arrives with shared context; another may connect people whose ordinary paths would never intersect. To decide whether dating has become worse, we would need to specify what “worse” means—fewer relationships, more disappointing searches, less safety, poorer relationships—and examine evidence for that outcome.
The home chart contains none of those measures. It can motivate the question. It cannot answer it on their behalf.
An invitation small enough to accept
There is a modest experiment that helps with one part of the problem: our expectation of an encounter.
In Nicholas Epley and Juliana Schroeder’s 2014 research, train and bus commuters assigned to talk with a stranger reported a more positive experience than those assigned to remain disconnected. Separate participants expected the opposite. Experiments 1 and 2
That is evidence about brief encounters in particular settings, not a prescription to interrupt everyone or a cure for loneliness. It suggests that anticipation can sometimes undervalue a conversation. Respecting another person’s wish for quiet remains part of making contact pleasant.
For someone who wants more company, a reasonable experiment is to lower the difficulty of one invitation. It need not be a purchase or a grand occasion. Tea at home, an accessible library event, a short walk where possible, or a scheduled call can each create a place in the week for another person.
flowchart TD
  accTitle: An invitation that leaves less to coordinate
  accDescr: An illustrative invitation specifies a manageable activity, an accessible place or call, and a time. Afterward, people can choose whether to repeat it. This is a suggestion, not a tested treatment.
  A["NAME SOMETHING SMALL<br/>Tea, a walk, or a call"] --> B["MAKE IT POSSIBLE<br/>Agree a time and access needs"]
  B --> C["LEAVE AN OPENING<br/>Would you like to do it again?"]
  class C anchor;
An illustrative approach to coordination, not a research-backed dosage of social life.
“We should catch up” asks the future to arrange everything. “I can call on Thursday after dinner” gives the other person something concrete to accept, change, or decline. Repetition is an option, not an obligation.
At the community level, the equivalent question is whether people have somewhere welcoming to meet without having to spend much money, and whether they can reach it. These are choices about access as well as personal enthusiasm.
To test the bigger explanation, researchers would need evidence connecting changes in people’s opportunities, time at home, in-person contact, and felt connection—ideally across time or after a clearly identified change in access. If contact improved without less home time, that would weaken the idea that leaving home itself is the essential ingredient.
The chart is therefore a good beginning for a question and a poor ending for an explanation of everything.
In our imagined Friday, the thing worth protecting was not the errand. It was the opening: a place where another person could become part of the evening. That opening can be a gate, a kitchen table, or a call someone has been hoping to receive.
The task is to make more of those openings possible.
Sources and reading notes
- Source post: Cole Jaczko, September 12, 2026. Its embedded chart ends in 2022.
- Location: Patrick Sharkey, Homebound, Sociological Science (2024). Methods and Figure 1; observational U.S. time diaries.
- Friendship timing: Neal Caren, The End of Friday Nights with Friends, Socius (August 20, 2026). Figure 1 and its discussion; data end in 2024.
- Definitions and access: CDC, Social Connection (2024).
- Hybrid work: Nicholas Bloom, Ruobing Han, and James Liang, randomized Trip.com trial, Nature (2024).
- Meeting partners: Michael J. Rosenfeld, Reuben J. Thomas, and Sonia Hausen, Disintermediating your friends, PNAS (2019).
- Brief encounters: Nicholas Epley and Juliana Schroeder, Mistakenly seeking solitude, Journal of Experimental Psychology: General (2014).
The chart uses published rounded values; chart data retain the definition and source locator. Diagrams explain distinctions and hypotheses, not estimated effects. No interviews or personal experiences were invented.